Here at Top Dollar, we spend a lot of time thinking about people’s finances. When we got wind of just how much real-world money people were spending on virtual items in MMO (massively multiplayer online) games, we just had to look into it.
Massively Multiplayer Online (MMO) games are games where players from around the world come together in the same virtual world. Role-playing games (RPG) like World Of Warcraft, online battle arenas like League of Legends and battle royale games like Fortnite are all examples of popular MMO games. But it’s not just RPG and open-world games; everything from sports to strategy games are bringing people together to compete online.
Most MMO games allow in-game spending, meaning players can swap their real world money for virtual currency, special abilities, clothing, or even virtual vehicles and property for their characters. But how much money do they usually spend, what games are they spending in and what payment methods do they use? We surveyed 1,000 gamers across America to find out.
The average MMO gamer
From these survey responses, we conducted a detailed analysis that allowed us to distill the profile of the average MMO gamer. You can see the full breakdown of our analysis here.
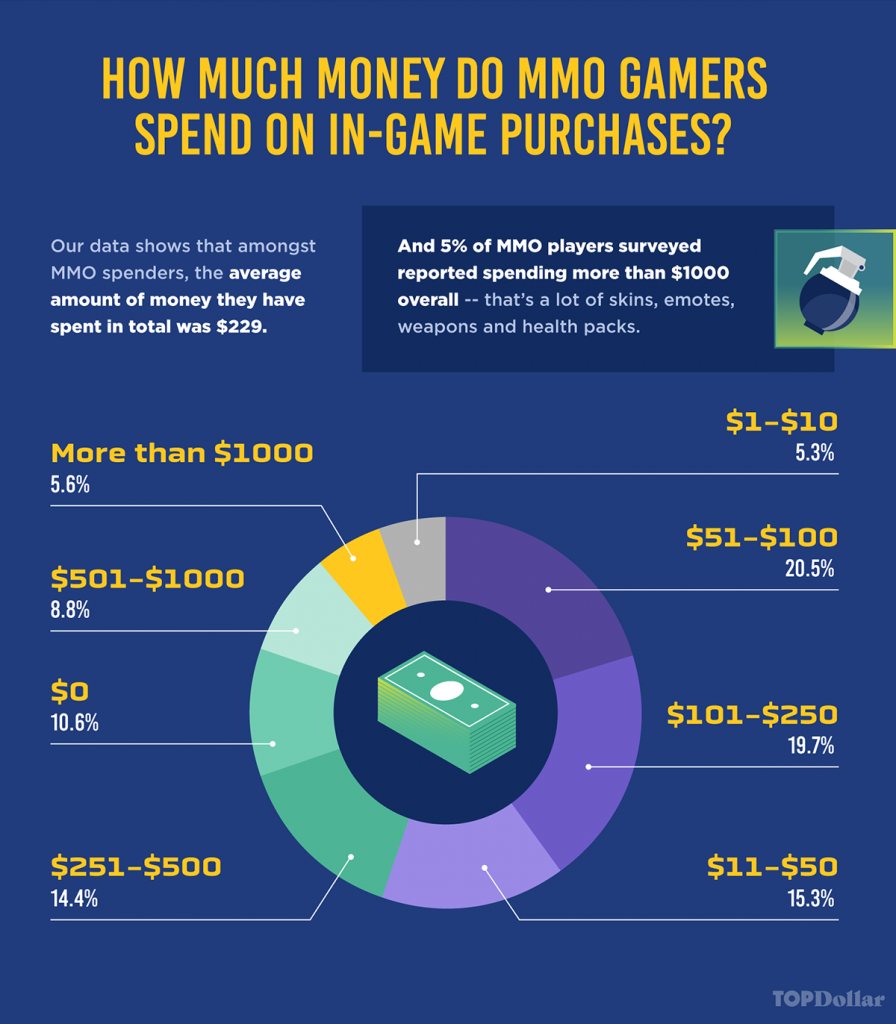
Over 60% of poll participants identified themselves as men and 37.9% as women. The average respondent was 32 years of age and reported spending three to six hours playing MMO games per day. Almost 90% said they have spent money on in-game purchases for MMO games, spending an average of $229 each in total.
How much do gamers spend?
We asked participants how much real world money they have spent in-game and found that the most common amount gamers spend on in-game purchases is between $51 and $100 in total. However, thanks to almost a third of gamers (28.8%) spending over $500, the average amount spent is a surprising $229.
See the full spending breakdown below:
Preferred payment methods
How do gamers pay for their purchases? Up until the age of 35 they are most likely to use debit cards, with over 40% of gamers using them. Almost one in two 35-55 year old respondents prefers credit cards, with gamers 65+ reportedly shunning digital payment methods such as PayPal and digital wallets.
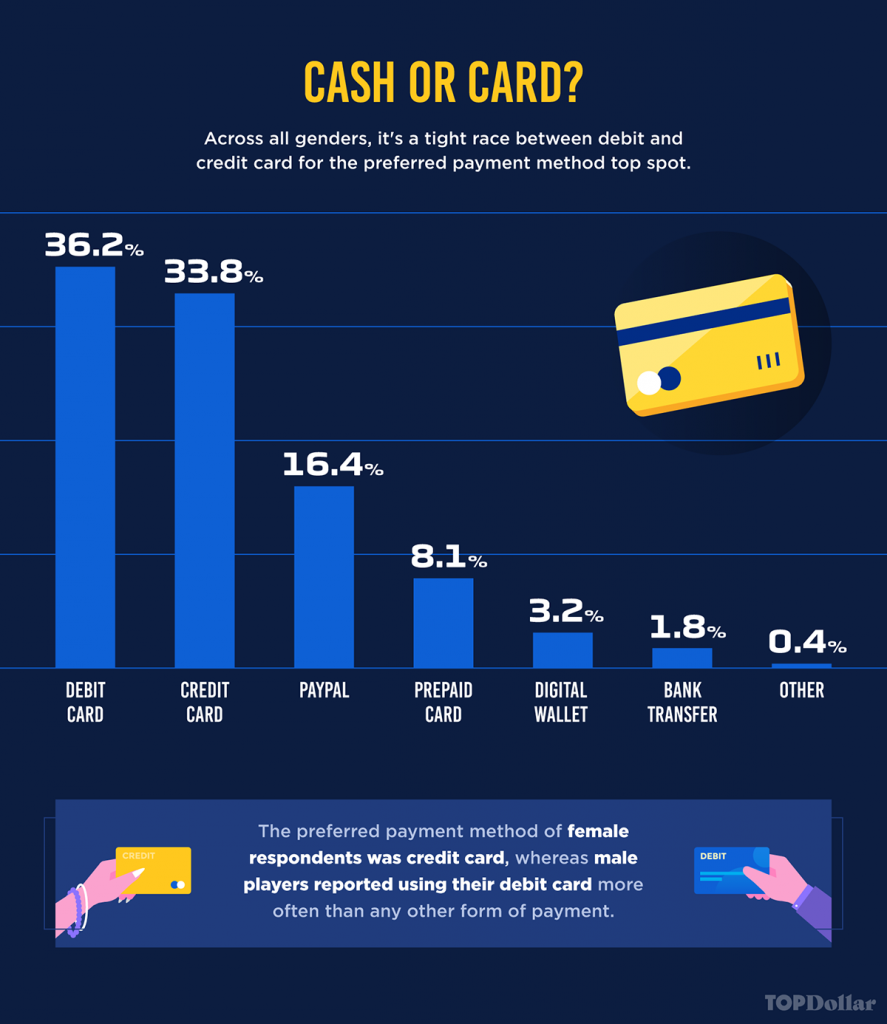
It appears that men have different ideas to women when it comes to choosing which card to use when they spend money in-game:
Gender and age preferences
Our survey revealed that the most popular game types with younger audiences were open world, battle royale and shooter games, while sports, combat and simulation games were more popular with older audiences.
We also found that male gamers are more likely to play sports, combat, action and real-time strategy games, whereas female gamers are 10% more likely to play simulation games than their male counterparts.
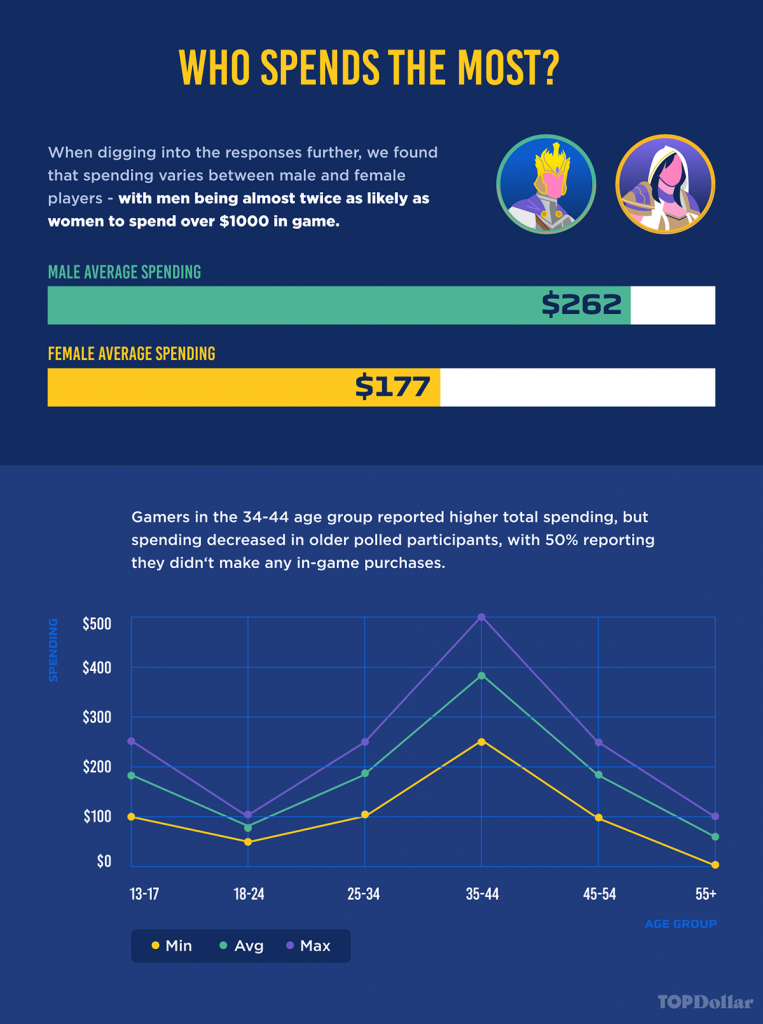
But it’s not just the type of games played that appear to be affected by gender and age, the amount spent in-game is different as well:
What are the most popular MMO game types for spending?
Some game types encourage more spending than others. Online battle arena, role-playing and combat games all draw heavy spending through in-game purchases.
Some 63.3% of gamers who have spent money on sports games have spent more than $100 on in-game purchases — the largest share of any game type.
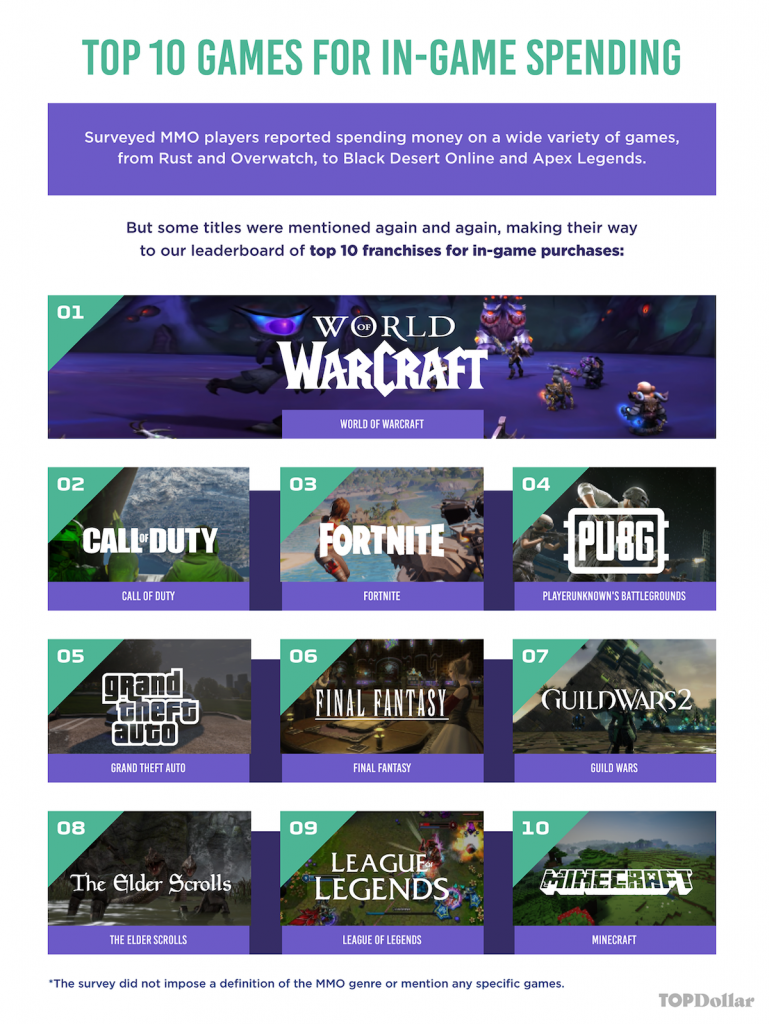
We’ve broken it all down by game type and created a leaderboard of the game franchises that encourage the most spending:
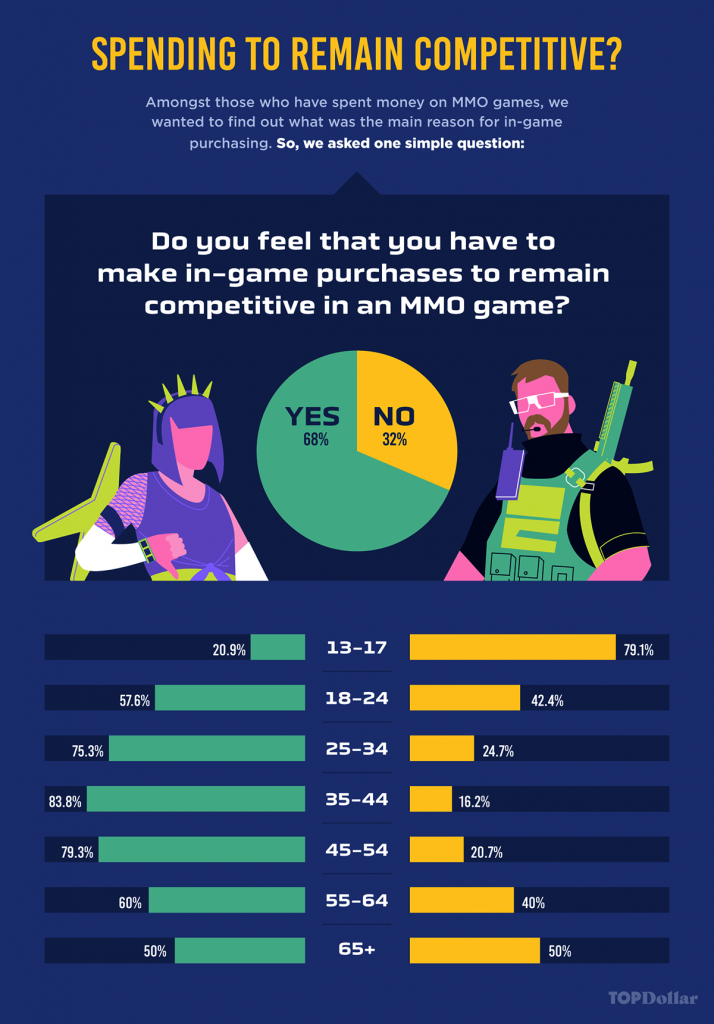
Do gamers think they have to spend to remain competitive?
Game creators obviously know a thing or two about marketing and designing their games to encourage spending; the majority of our respondents believe they have to spend to remain competitive.
Our data also reveals that respondents who believe in-game purchases are necessary are also more likely to be serious gamers: 76.0% of gamers who believe in the importance of in-game purchases play MMOs for around 2 hours or more per day, compared to 61.4% of gamers who do not believe in-game purchases are necessary.
The MMO industry is showing no signs of getting any less ‘massive’. In fact, these virtual worlds are likely to grow and grow, along with the bank balances of the game producers. But it’s not just the money we’re interested in, this unique look into the world of MMO gamers gives us some wonderful insights into human nature.
Our survey has uncovered everything from how much people spend to what games they spend the most on. We didn’t stop there though – we put our survey results under the microscope to reveal the spending patterns and sentiment across gender and age groups.
Read on to find the complete infographic along with the full results of the survey.

Methodology
The data we used to make these visualizations was taken from an online poll commissioned by Accredited Debt Relief and conducted by Savanta. The poll surveyed 1,000 Americans that identified massively multiplayer online games as the main video games they play. The survey was conducted over a seven day period, from Tuesday, 11th February to Tuesday, 18th February.
Keep reading on for the full results from the survey:
1. What gender do you identify as?
- 37.9% answered “Female”
- 61.5% answered “Male”
- 0.6 % answered “Other”
2. How old are you?
- The average age was 32.
- The most common age was 35 (78 respondents).
3. Which, if any, of the following activities do you do in your spare time?
A. Exercise
- 66.5% of ‘MMO gamers’ said ‘Yes’ they also exercise.
- 33.5% of ‘MMO gamers’ said ‘No’ they don’t exercise
B. Reading/Writing
- 60.1% of ‘MMO gamers’ said ‘Yes’ they also read or write.
- 39.9% of ‘MMO gamers’ said ‘No’ they don’t read or write.
C. Spend time with friends or family
- 78.6% of ‘MMO gamers’ said ‘Yes’ they do also spend time with friends and family.
- 21.4% of ‘MMO gamers’ said ‘No’ they don’t spend time with friends and family.
D. Cooking
- 59.4% of ‘MMO gamers said ‘Yes’ they also cook.
- 40.6% of ‘MMO gamers’ said ‘No’ they don’t cook.
E. Watching TV
- 86.2% of ‘MMO gamers’ said ‘Yes’ they also watch TV.
- 13.8% of ‘MMO gamers’ said ‘No’ they don’t watch TV.
F. Other
- 6.9% of ‘MMO gamers’ said ‘Yes’ they do ‘other’ things.
- 93.1% of ‘MMO gamers’ said ‘No’ to don’t do ‘other’ things.
4. Which, if any, of the below game types do you play?
A. Simulations
- 50.7% of ‘MMO gamers’ said ‘Yes’ they also play ‘Simulation’ games.
- 49.3% of ‘MMO gamers’ said ‘No’ they don’t play ‘Simulation’ games.
B. Adventure
- 71.2% of ‘MMO gamers’ said ‘Yes’ they also play ‘Adventure’ games.
- 28.8% of ‘MMO gamers’ said ‘No’ they don’t play ‘Adventure’ games.
C. Real-Time Strategy (RTS)
- 50.8% of ‘MMO gamers’ said ‘Yes’ they also play ‘Real-Time Strategy (RTS)’ games.
- 49.2% of ‘MMO gamers’ said ‘No’ they don’t play ‘Real-Time Strategy (RTS)’ games.
D. Puzzle
- 51.2% of ‘MMO gamers’ said ‘Yes’ they also play ‘Puzzle’ games.
- 48.8% of ‘MMO gamers’ said ‘No’ they don’t play ‘Puzzle’ games.
E. Action
- 72.2% of ‘MMO gamers’ said ‘Yes’ they also play ‘Action’ games.
- 27.8% of ‘MMO gamers’ said ‘No’ they don’t play ‘Action’ games.
F. Combat
- 62.5% of ‘MMO gamers’ said ‘Yes’ they also play ‘Combat’ games.
- 34.8% of ‘MMO gamers’ said ‘No’ they don’t play ‘Combat’ games.
G. Sports
- 55.3% of ‘MMO gamers’ said ‘Yes’ they also play ‘Sports’ games.
- 44.7% of ‘MMO gamers’ who said ‘No’ they don’t play ‘Sports’ games.
H. Role-Playing (RPG)
- 63.5% of ‘MMO gamers’ said ‘Yes’ they also play ‘Role-Playing (RPG)’ games.
- 36.5% of ‘MMO gamers’ said ‘No’ they don’t ‘Role-Playing (RPG)’ games.
I. Educational
- 24.8% of ‘MMO gamers’ said ‘Yes’ they also play ‘Educational’ games.
- 72.5% of ‘MMO gamers’ said ‘No’ they don’t play ‘Educational’ games.
J. Other
- 4.3% of ‘MMO gamers’ said ‘Yes’ they also play ‘Other’ game types.
- 95.7% of ‘MMO gamers’ said No’ they don’t play ‘Other’ game types.
5. What’s the primary device you use to play MMO games?
- PC – 29.20%
- Xbox – 25.90%
- PS4 – 24.10%
- Mobile Device – 13.80%
- Switch – 4.10%
- Mac – 2.30%
- Other – 0.60%
6. How much money have you spent on in-game purchases overall?
Total (male and female)
- $0 (I have never spent money on in-game purchases): 10.60%
- $1 – $10: 5.30%
- $11 – $50: 15.30%
- $51 – $100: 20.50%
- $101 – $250: 19.70%
- $251 – $500: 14.40%
- $501 – $1000: 8.80%
- More than $1000: 5.60%
Female
- $0 – I have never spent money on in-game purchases: 13.90%
- $1 – $10: 6.30%
- $11 – $50: 16.60%
- $51 – $100: 22.10%
- $101 – $250: 20.50%
- $251 – $500: 11.60%
- $501 – $1000: 5.30%
- More than $1000: 3.70%
Male
- $0 – I have never spent money on in-game purchases: 8.30%
- $1 – $10: 4.70%
- $11 – $50: 14.30%
- $51 – $100: 19.50%
- $101 – $250: 19.30%
- $251 – $500: 16.20%
- $501 – $1000: 11.00%
- More than $1000: 6.70%
7. What MMO game(s) have you spent money on?
- Role-playing – 36.75%
- Shooter – 17.32%
- Battle royale – 15.09%
- Open world – 10.10%
- Action – 4.07%
- Sports – 3.94%
- Simulation – 3.28%
- Online battle arena – 3.02%
- Combat – 2.89%
- Strategy – 1.97%
- Casino – 0.79%
- Puzzle – 0.79%
8. How much of your total spending in an MMO game goes towards cosmetic items, including skins, emotes, clothing and audio packs?
- 0% (I’ve spent no money on these items): 9.70%
- Less than 10%: 14.30%
- 10% – 25%: 26.00%
- 26% – 50%: 29.30%
- 51% – 75%: 11.30%
- 76% – 100%: 9.30%
9. How much of your total spending in an MMO game goes towards non-cosmetic items, including characters, weapons, items, health packs and loot crates?
- 0% (I’ve spent no money on these items): 8.30%
- Less than 10%: 13.00%
- 10% – 25%: 26.00%
- 26% – 50%: 26.30%
- 51% – 75%: 18.00%
- 76% – 100%: 8.30%
10. What payment method do you normally use to pay for in-game purchases?
- Debit card – 36.20%
- Credit card – 33.80%
- Paypal – 16.40%
- Prepaid card – 8.10%
- Digital wallet – 3.20%
- Bank transfer – 1.80%
- Other – 0.40%
11. Do you feel that you have to make in-game purchases to remain competitive in an MMO game?
- Yes – 68%
- No – 32%
12. In your best estimation, how many hours a day do you spend playing MMO games?
- 10 minutes or less – 3.10%
- Around 30 minutes – 6.90%
- Around 1 hour – 20.80%
- Around 2 hours – 29.80%
- Around 3 to 6 hours – 30.10%
- 6 hours or more – 9.30%
Sources
Babalon. (2020). Top 6 Most Popular MMORPGs Sorted by Population (2020). altarofgaming.com
Gough, C. (2019). Gaming monetization – Statistics & Facts. statista.com
Leack, J. (2017). World of Warcraft Leads Industry With Nearly $10 Billion in Revenue. gamerevolution.com
Olivetti, J. (2012). The Game Archaeologist discovers the Island of Kesmai. engadget.com
Olivetti, J. (2012). The Game Archaeologist: Maze War. engadget.com
Shmuplations. (2020). Yoshio Kiya – 1987 Developer Interview. shmuplations.com
WePC. (2020). 2020 Video Game Industry Statistics, Trends & Data. wepc.com
To see the full results and analysis behind the survey, visit bit.ly/MMOMoneyMMOProblems